Task 1 Introduction
Splunk is a powerful SIEM solution that provides the ability to search and explore machine data. Search Processing Language (SPL) is used to make the search more effective. It comprises various functions and commands used together to form complex yet effective search queries to get optimized results.
This room will dive deep into some key fundamentals of searching capability, like chaining SPL queries to construct simple to complex queries.
Learning Objectives
This room will teach the following topics:
- What are Search processing Language?
- How to apply filters to narrow down results.
- Using transformational commands.
- Changing the order of the results.
Room Prerequisites
- This room is based on the SIEM concepts covered in Intro to SIEM and Splunk: Basics rooms. Complete these rooms and continue to the next task.
Task 2 Connect with the Lab
Room Machine
Before moving forward, deploy the machine. You can access this lab in the AttackBox or click MACHINE_IP to start the lab in your browser when the machine is fully started. The machine will take up to 3-5 minutes to start.
Note: For this room, we will work on the index Windowslogs.
What is the name of the host in the Data Summary tab?
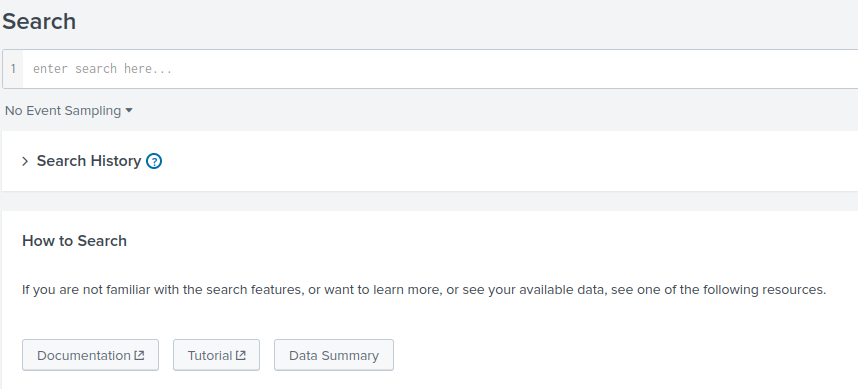
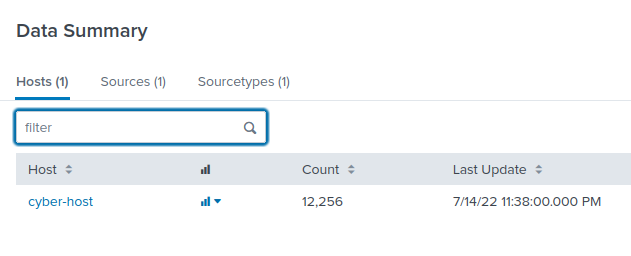

Answer: cyber-host
Task 3 Search & Reporting App Overview
Search & Reporting App is the default interface used to search and analyze the data on the Splunk Home page. It has various functionalities that assist analysts in improving the search experience.

Some important functionalities present in the search App are explained below:
1) Search Head: Search Head is where we use search processing language queries to look for the data.

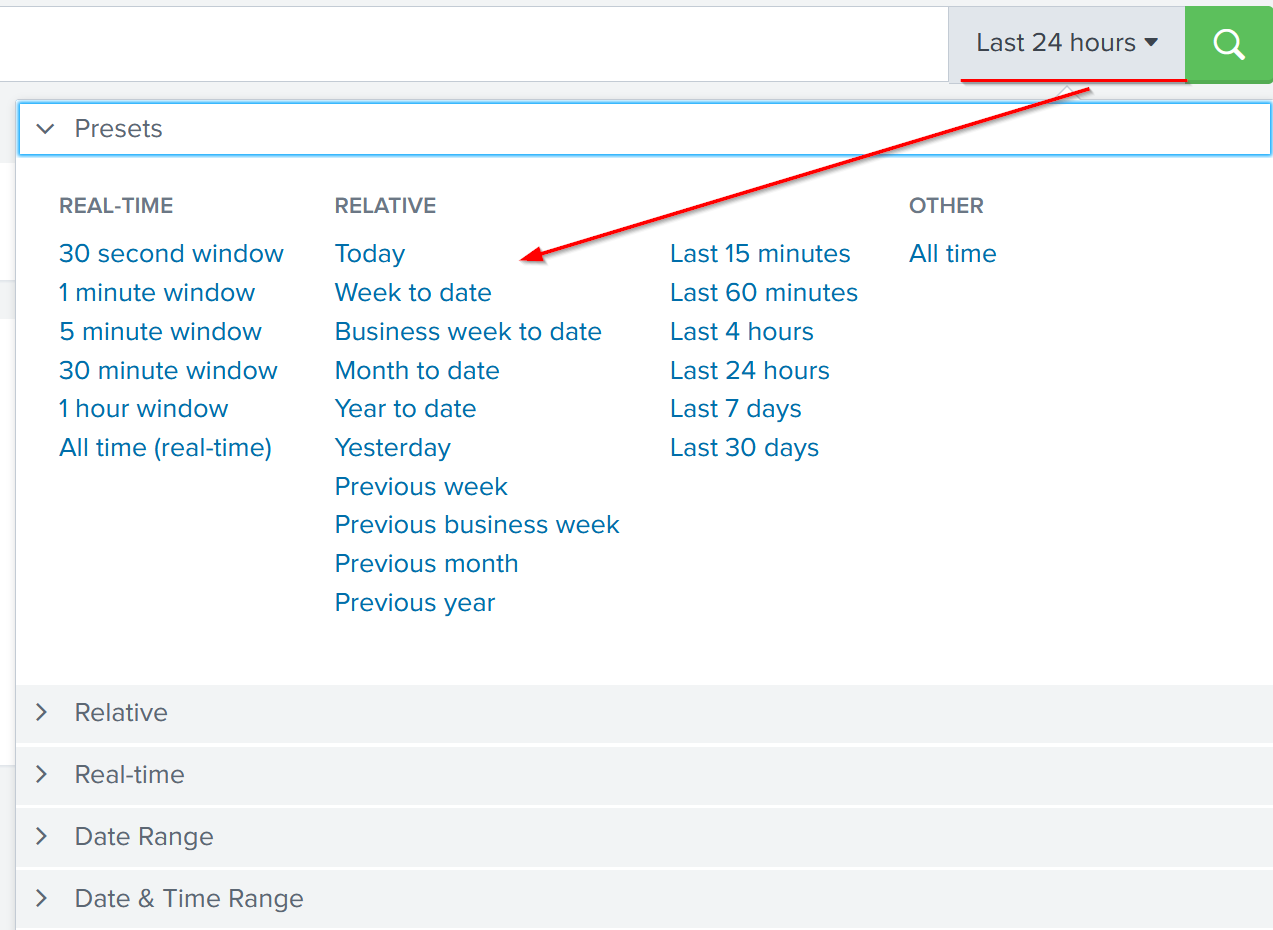
2) Time Duration: This tab option provides multiple options to select the time duration for the search. All-time will display the events in real-time. Similarly, the last 60 minutes will display all the events captured in the last hour.
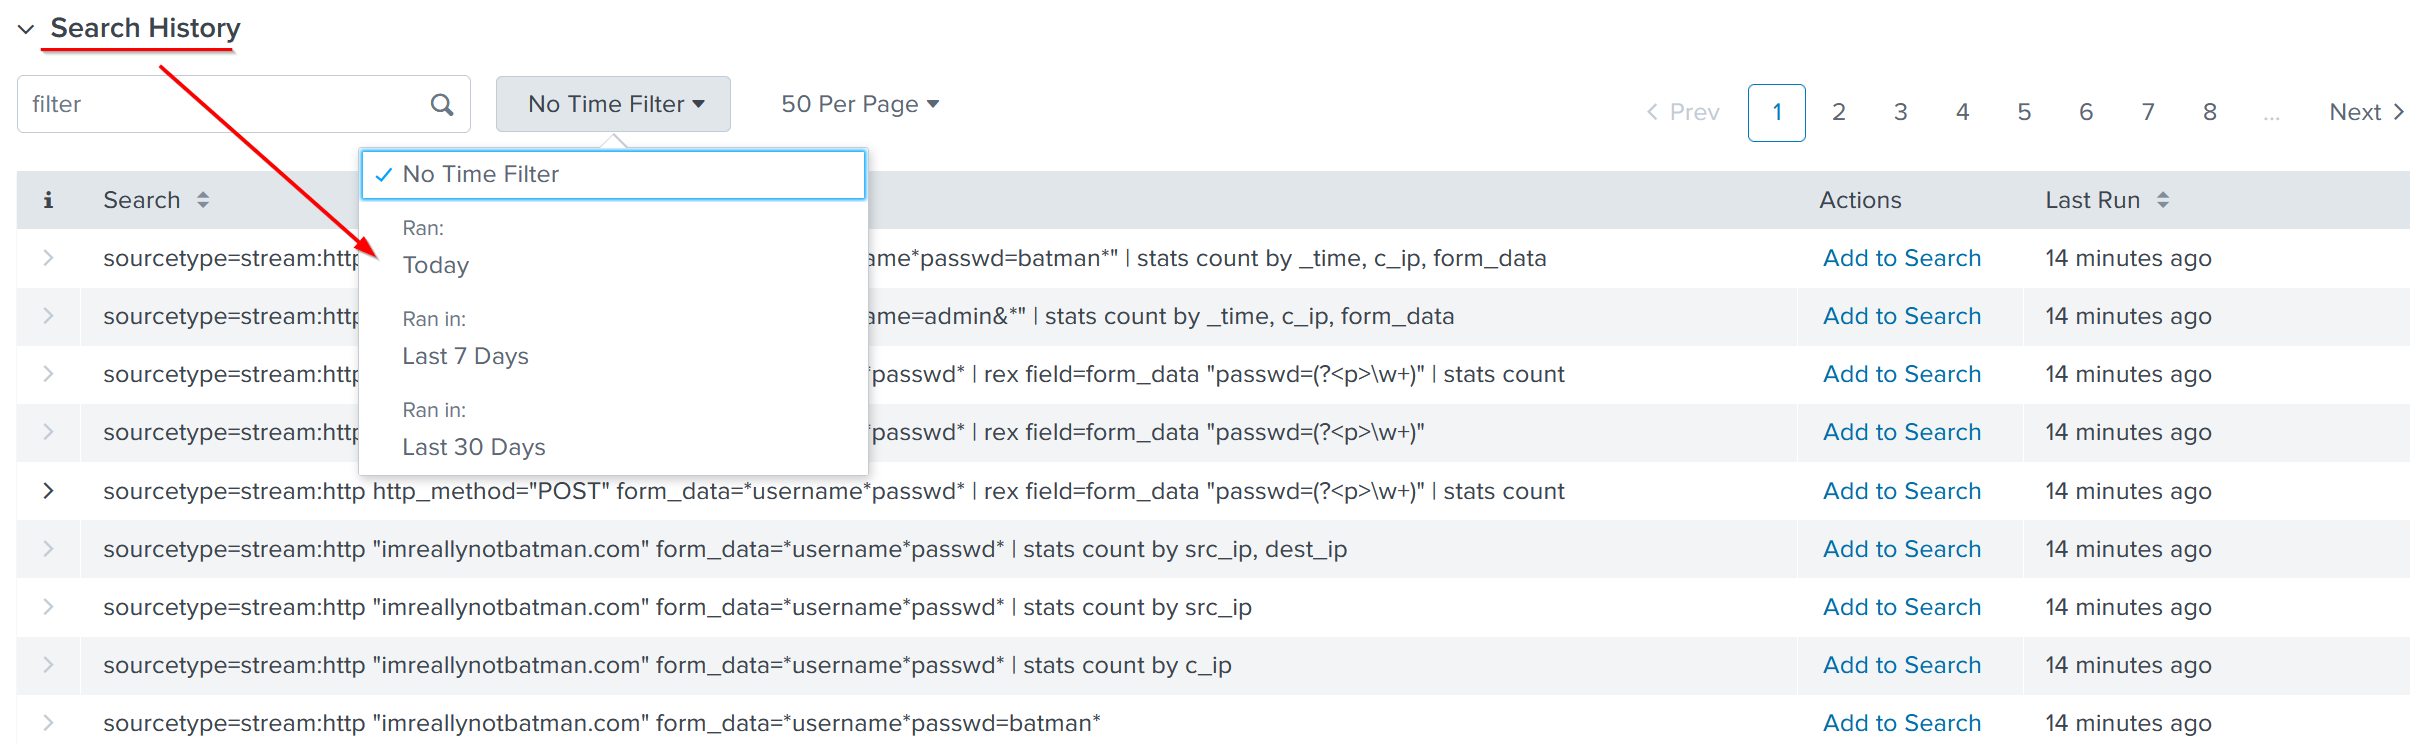
3) Search History: This tab saves the search queries that the user has run in the past along with the time when it was run. It lets the user click on the past searches and look at the result. The filter option is used to search for the particular query based on the term.
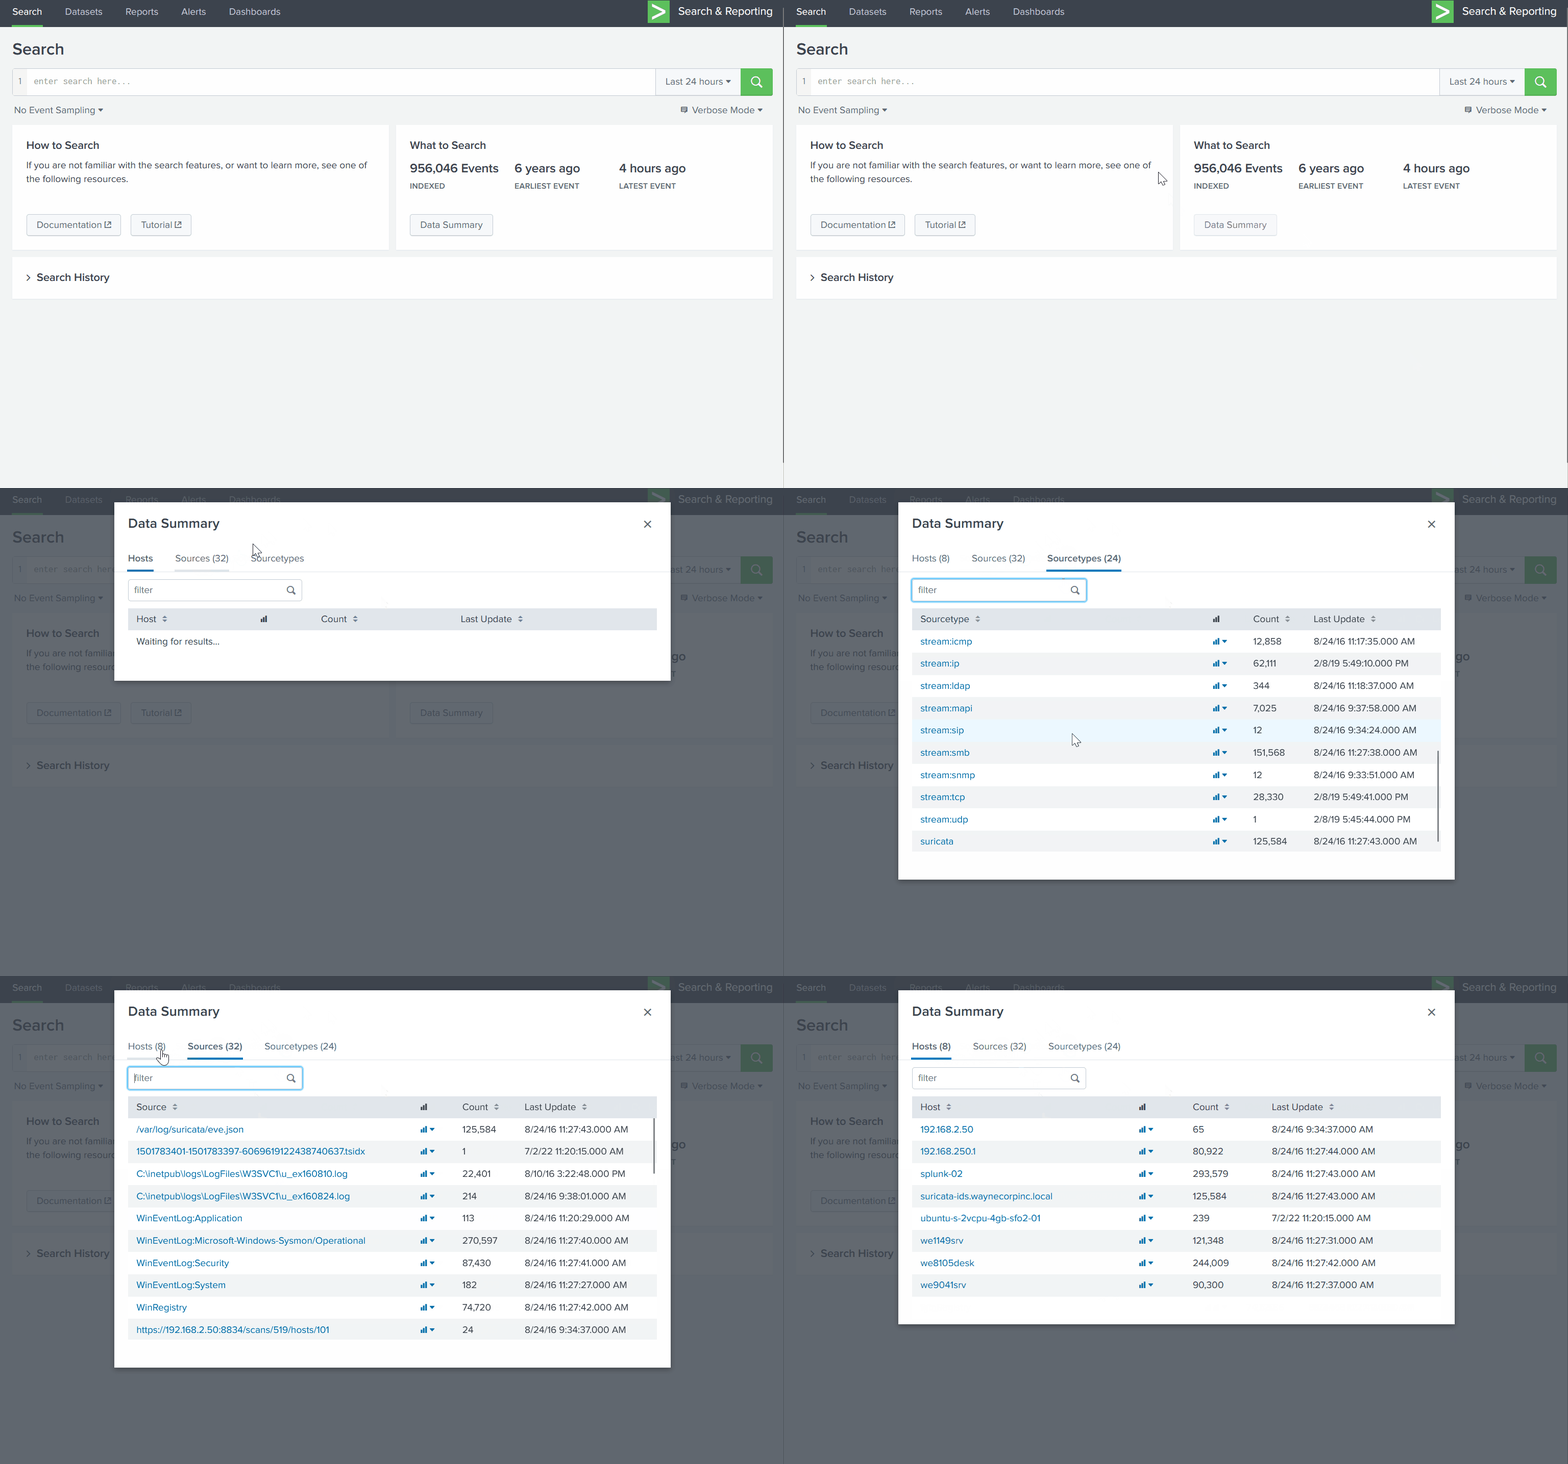
4) Data Summary: This tab provides a summary of the data type, the data source, and the hosts that generated the events as shown below. This tab is very important feature used to get a brief idea about the network visibility.
5) Field Sidebar: The Field Sidebar can be found on the left panel of Splunk search. This sidebar has two sections showing selected fields and interesting fields. It also provides quick results, such as top values and raw values against each field.
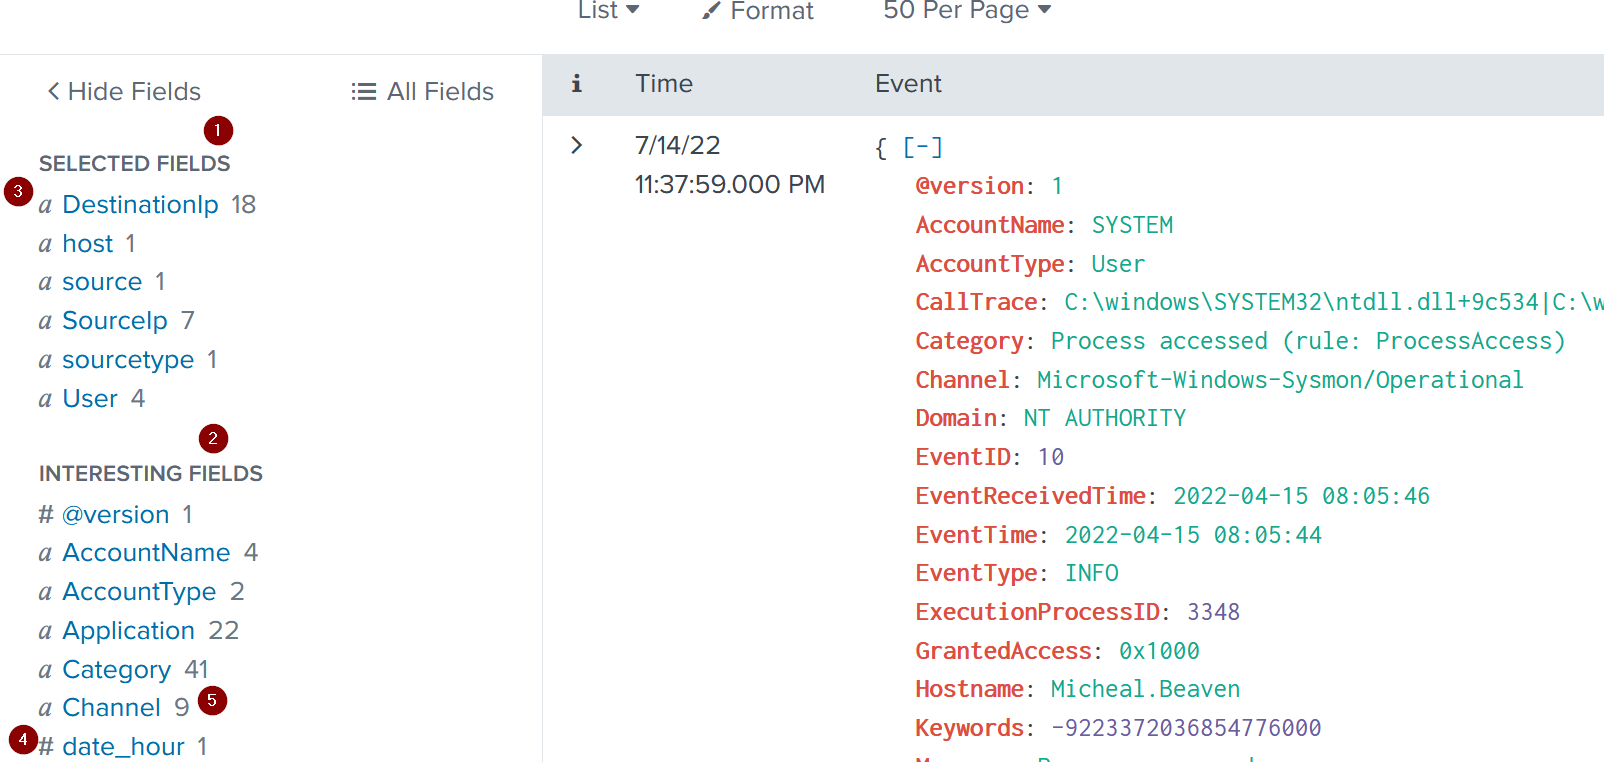
Some important points to understand about the sidebar are explained below:
| 1- Selected Fields | Splunk extracts the default fields like source, sourcetype, and host, which appear in each event, and places them under the selected fields column. We can select other fields that seem essential and add them to the list. |
| 2- Interesting Fields | Pulls all the interesting fields it finds and displays them in the left panel to further explore. |
| 3- Alpha-numeric fields 'α' | This alpha symbol shows that the field contains text values. |
| 4- Numeric fields '#' | This symbol shows that this field contains numerical values. |
| 5- Count | The number against each field shows the number of events captured in that timeframe. |
Answer the questions below
In the search History, what is the 7th search query in the list? (excluding your searches from today)
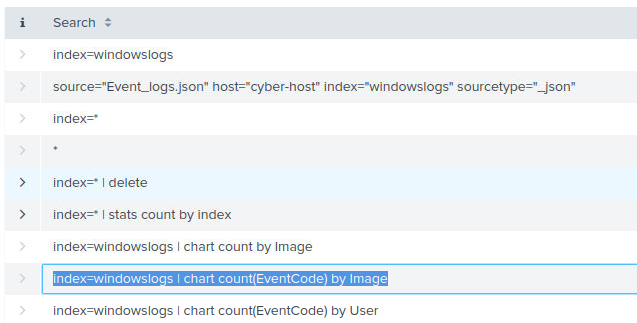
Answer: index=windowslogs | chart count(EventCode) by Image
In the left field panel, which Source IP has recorded max events?
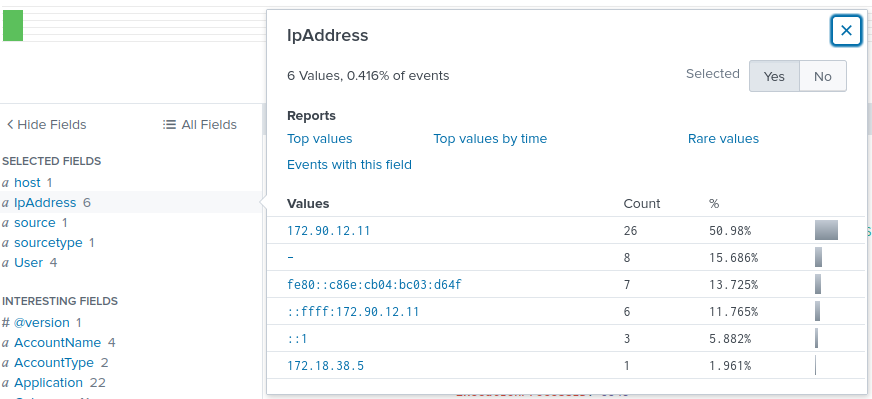
Answer: 172.90.12.11
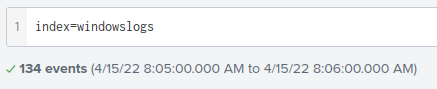
How many events are returned when we apply the time filter to display events on 04/15/2022 and Time from 08:05 AM to 08:06 AM?
Use the Date time range and change the parameter to between. Set the given date and time.
Answer: 134
Task 4 Splunk Processing Language Overview
Splunk Search Processing Language comprises of multiple functions, operators and commands that are used together to form a simple to complex search and get the desired results from the ingested logs. Main components of SPL are explained below:
Search Field Operators
Splunk field operators are the building blocks used to construct any search query. These field operators are used to filter, remove, and narrow down the search result based on the given criteria. Common field operators are Comparison operators, wildcards, and boolean operators.
Comparison Operators
These operators are used to compare the values against the fields. Some common comparisons operators are mentioned below:
| Field Name |
Operator |
Example | Explanation |
| Equal |
= | UserName=Mark | This operator is used to match values against the field. In this example, it will look for all the events, where the value of the field UserName is equal to Mark. |
| Not Equal to |
!= | UserName!=Mark | This operator returns all the events where the UserName value does not match Mark. |
| Less than |
< | Age < 10 | Showing all the events with the value of Age less than 10. |
| Less than or Equal to |
<= | Age <= 10 | Showing all the events with the value of Age less than or equal to 10. |
| Greater than |
> | Outbound_traffic > 50 MB | This will return all the events where the Outbound traffic value is over 50 MB. |
| Greater Than or Equal to |
>= | Outbound_traffic >= 50 MB | This will return all the events where the Outbound traffic value is greater or equal to 50 MB. |
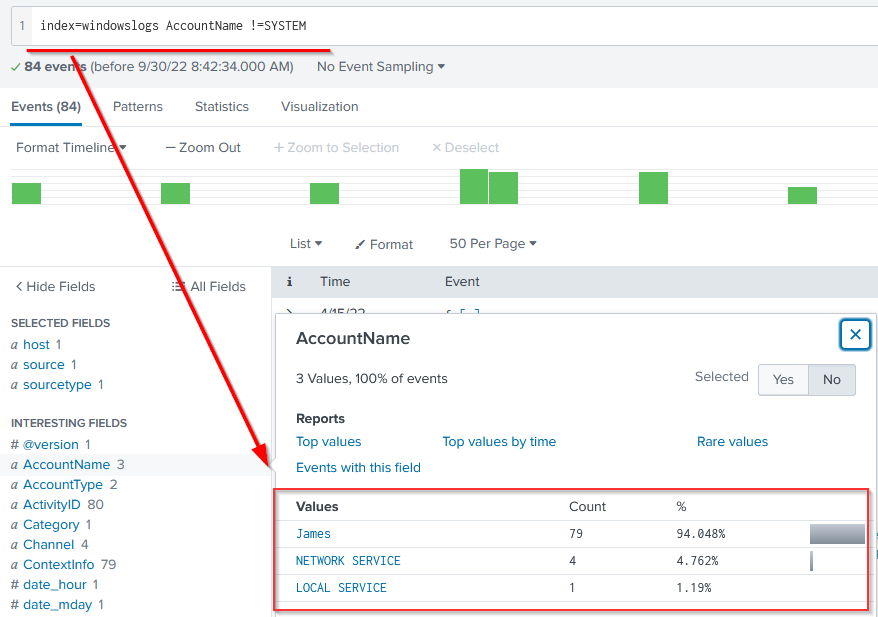
Lets use the comparison operator to display all the event logs from the index "windowslogs", where AccountName is not Equal to "System"
Search Query: index=windowslogs AccountName !=SYSTEM
Boolean Operators
Splunk supports the following Boolean operators, which can be very handy in searching/filtering and narrowing down results.
| Operator |
Syntax |
Explanation |
| NOT |
field_A NOT value | Ignore the events from the result where field_A contain the specified value. |
| OR |
field_A=value1 OR field_A=value2 | Return all the events in which field_A contains either value1 or value2. |
| AND |
field_A=value1 AND field_B=value2 | Return all the events in which field_A contains value1 and field_B contains value2. |
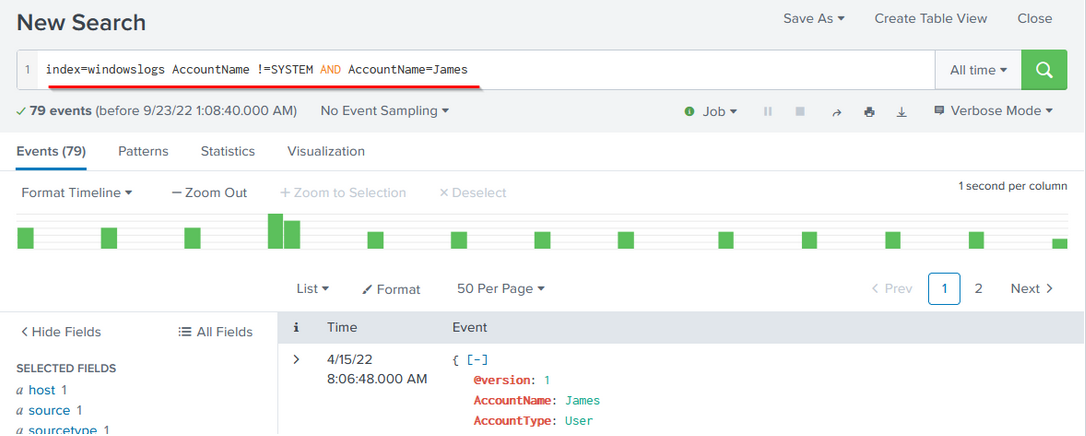
To understand how boolean operator works in SPL, lets add the condition to show the events from the James account.
Search Query: index=windowslogs AccountName !=SYSTEM **AND** AccountName=James
Wild Card
Splunk supports wildcards to match the characters in the strings.
| Wildcard symbol | Example | Explanation |
| *** ** |
status=fail* | It will return all the results with values like status=failed status=failure |
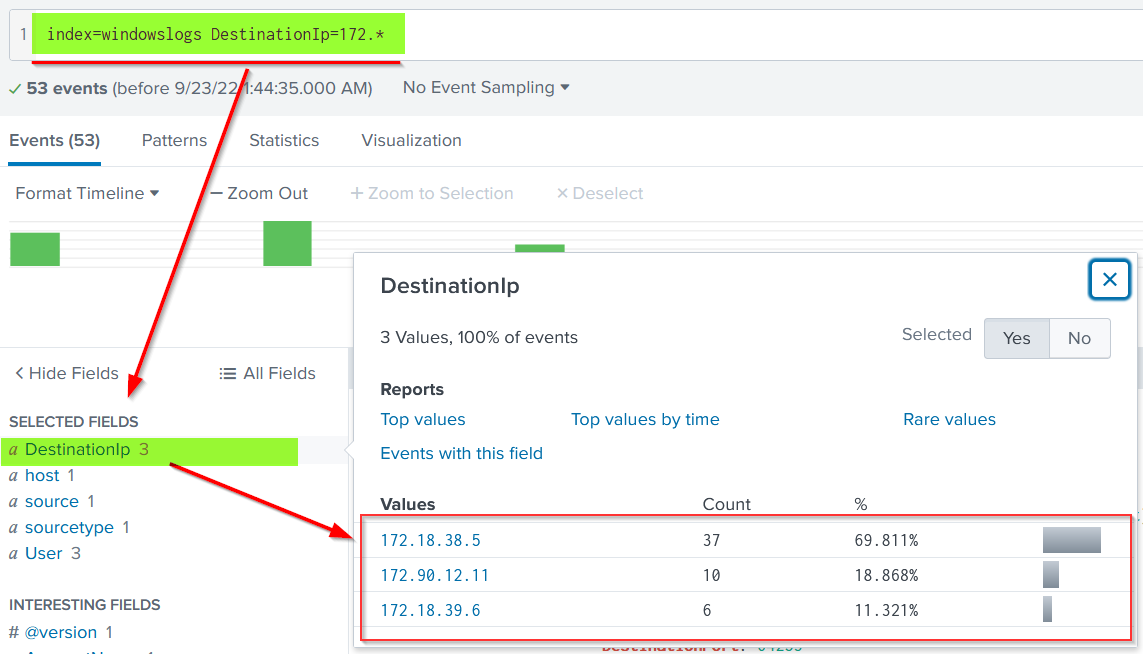
In the events, there are multiple DestinationIPs reported. Let's use the wildcard only to show the DestinationIP starting from 172.*
Search Query: index=windowslogs DestinationIp=172.*
Answer the questions below
How many Events are returned when searching for Event ID 1 AND User as James?
index=windowslogs EventID=1 AND User=*James*
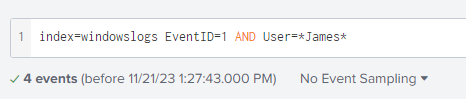
Answer: 4
How many events are observed with Destination IP 172.18.39.6 AND destination Port 135?
index=windowslogs DestinationIp=172.18.39.6 AND DestinationPort="135"

Answer: 4
What is the Source IP with highest count returned with this Search query?
Search Query: index=windowslogs Hostname="Salena.Adam" DestinationIp="172.18.38.5"

Answer: 172.90.12.11
In the index windowslogs, search for all the events that contain the term cyber how many events returned?
index=windowslogs cyber
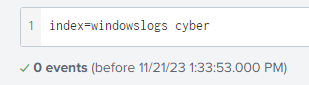
Answer: 0
Now search for the term cyber*, how many events are returned?
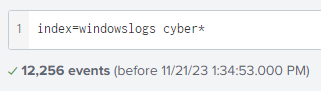
Answer: 12256
Task 5 Filtering the Results in SPL
Our network generates thousands of logs each minute, all ingesting into our SIEM solution. It becomes a daunting task to search for any anomaly without using filters. SPL allows us to use Filters to narrow down the result and only show the important events that we are interested in. We can add or remove certain data from the result using filters. The following commands are useful in applying filters to the search results.
Fields
| Command | fields |
| Explanation |
Fields command is used to add or remove mentioned fields from the search results. To remove the field, minus sign ( - ) is used before the fieldname and plus ( + ) is used before the fields which we want to display. |
| Syntax |
| fields |
| Example | | fields + HostName - EventID |
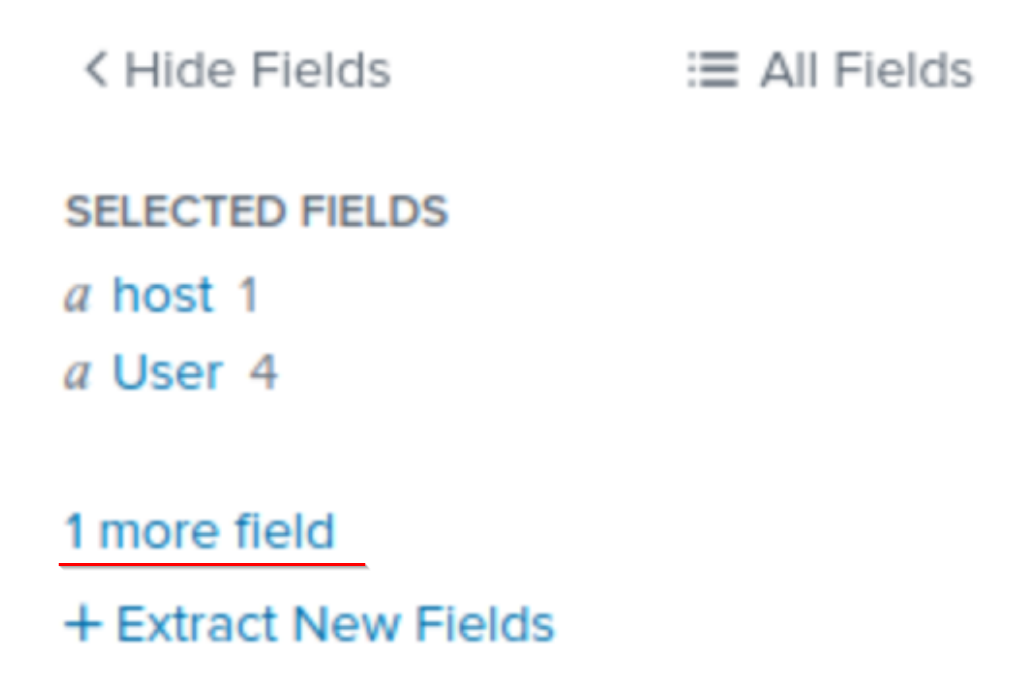
Let's use the fields command to only display host, User, and SourceIP fields using the following syntax.
Search Query: index=windowslogs | fields + host + User + SourceIp
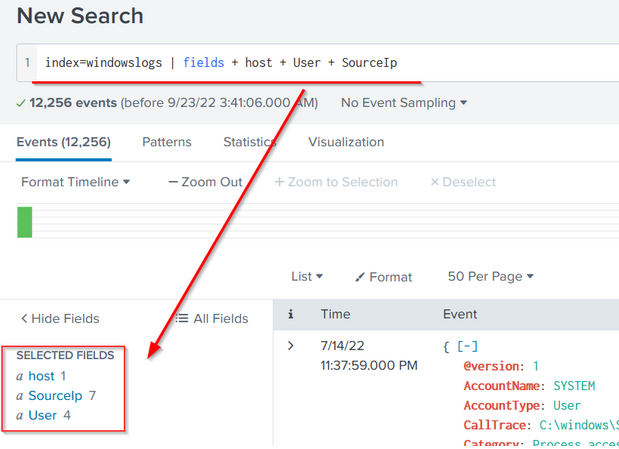
Note: Click on the More field to display the fields if some fields are not visible.
Search
| Command | search |
| Explanation |
This command is used to search for the raw text while using the chaining command \| |
| Syntax |
| search |
| Example | | search "Powershell" |
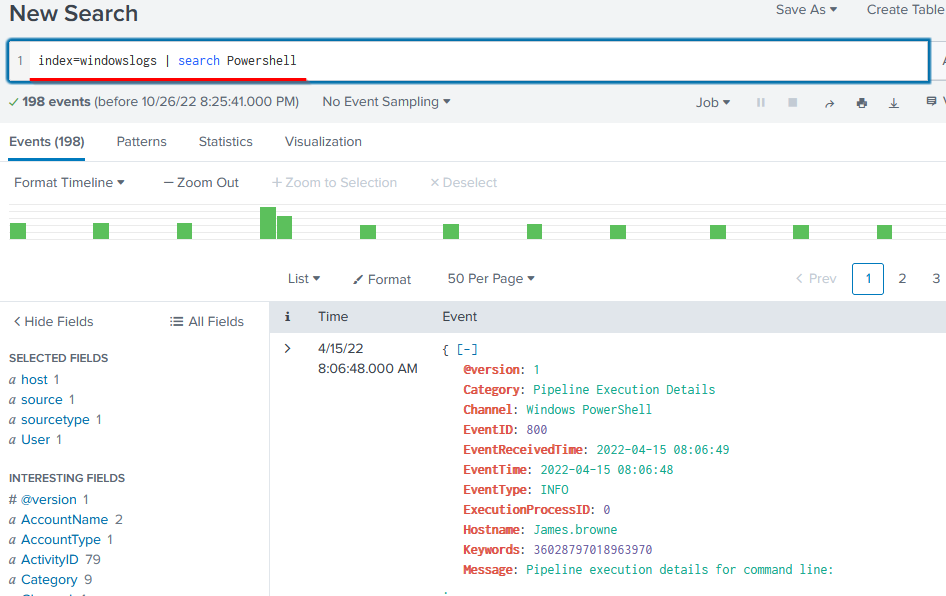
Use the search command to show all the events containing the term Powershell. This will return all the events that contain the term "Powershell".
Search Query: index=windowslogs | search Powershell
Dedup
| Command | dedup |
| Explanation |
Dedup is the command used to remove duplicate fields from the search results. We often get the results with various fields getting the same results. These commands remove the duplicates to show the unique values. |
| Syntax |
| dedup |
| Example | | dedup EventID |
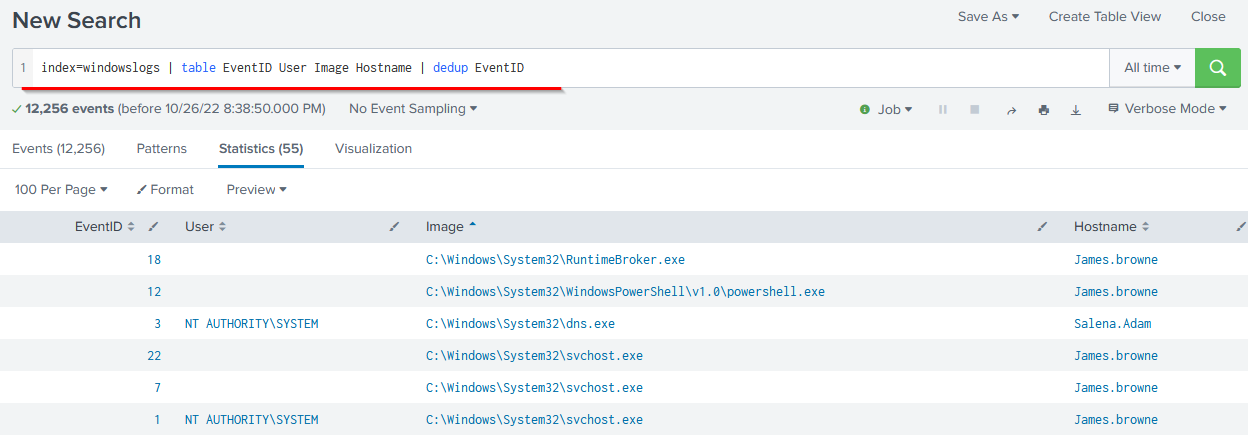
We can use the dedup command to show the list of unique EventIDs from a particular hostname.
Search Query: index=windowslogs | table EventID User Image Hostname | dedup EventID
Rename
| Command | rename |
| Explanation |
It allows us to change the name of the field in the search results. It is useful in a scenario when the field name is generic or log, or it needs to be updated in the output. |
| Syntax |
| rename |
| Example | | rename User as Employees |
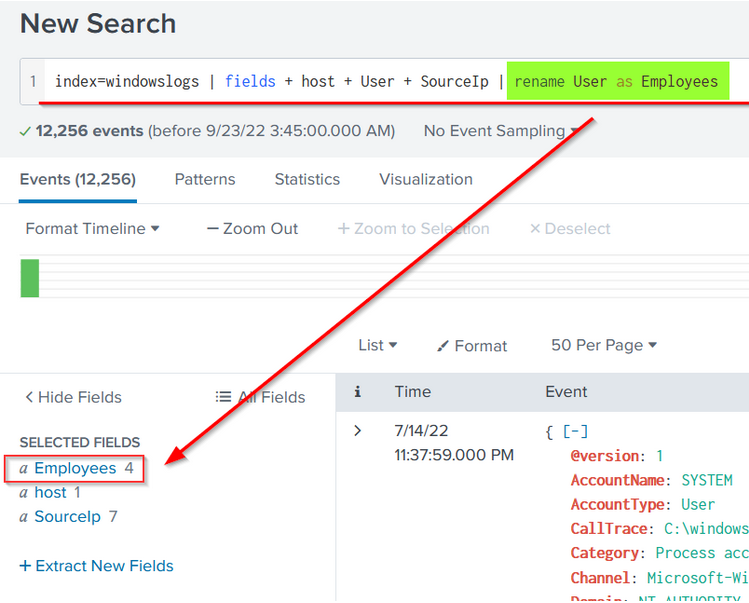
Let's rename the User field to Employees using the following search query.
Search Query:index=windowslogs | fields + host + User + SourceIp | rename User as Employees
Answer the questions below
What is the third EventID returned against this search query?
Search Query: index=windowslogs | table _time EventID Hostname SourceName | reverse

Answer: 4103
Use the dedup command against the Hostname field before the reverse command in the query mentioned in Question 1. What is the first username returned in the Hostname field?
index=windowslogs | table _time EventID Hostname SourceName | dedup Hostname
| reverse

Answer: Salena.Adam
Task 6 SPL - Structuring the Search Results
SPL provides various commands to bring structure or order to the search results. These sorting commands like head, tail, and sort can be very useful during logs investigation. These ordering commands are explained below:
Table
| Explanation |
Each event has multiple fields, and not every field is important to display. The Table command allows us to create a table with selective fields as columns. |
| Syntax |
| table |
| Example | | table | head 20 # will return the top 20 events from the result list. |
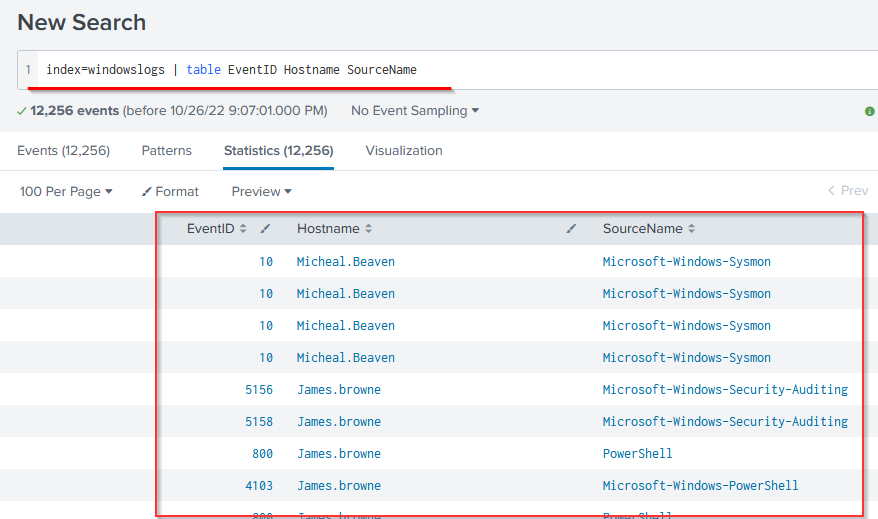
This search query will create a table with three columns selected and ignore all the remaining columns from the display.
Search Query: index=windowslogs | table EventID Hostname SourceName
Head
| Explanation |
The head command returns the first 10 events if no number is specified. |
| Syntax |
| head |
| Example | | head # will return the top 10 events from the result list| head 20 # will return the top 20 events from the result list |
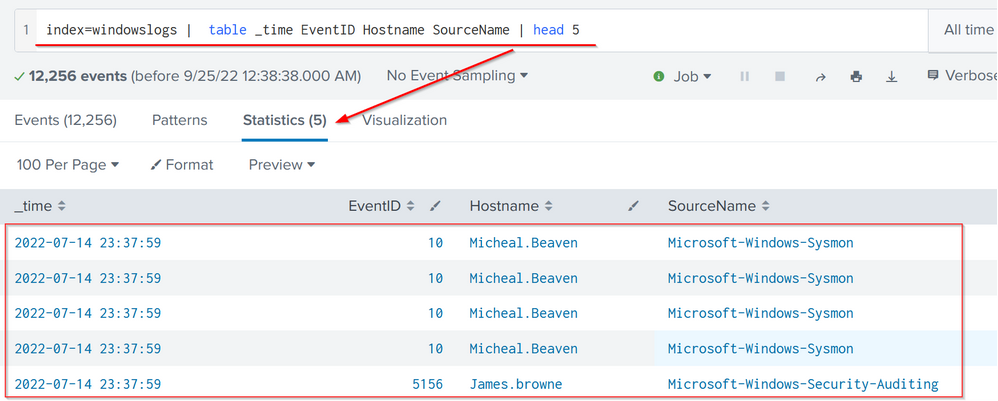
The following search query will show the table containing the mentioned fields and display only the top 5 entries.
Search Query: index=windowslogs | table _time EventID Hostname SourceName | **head 5**
Tail
| Explanation |
The Tail command returns the last 10 events if no number is specified. |
| Syntax |
| tail |
| Example | | tail # will return the last 10 events from the result list| tail 20 # will return the last 20 events from the result list |
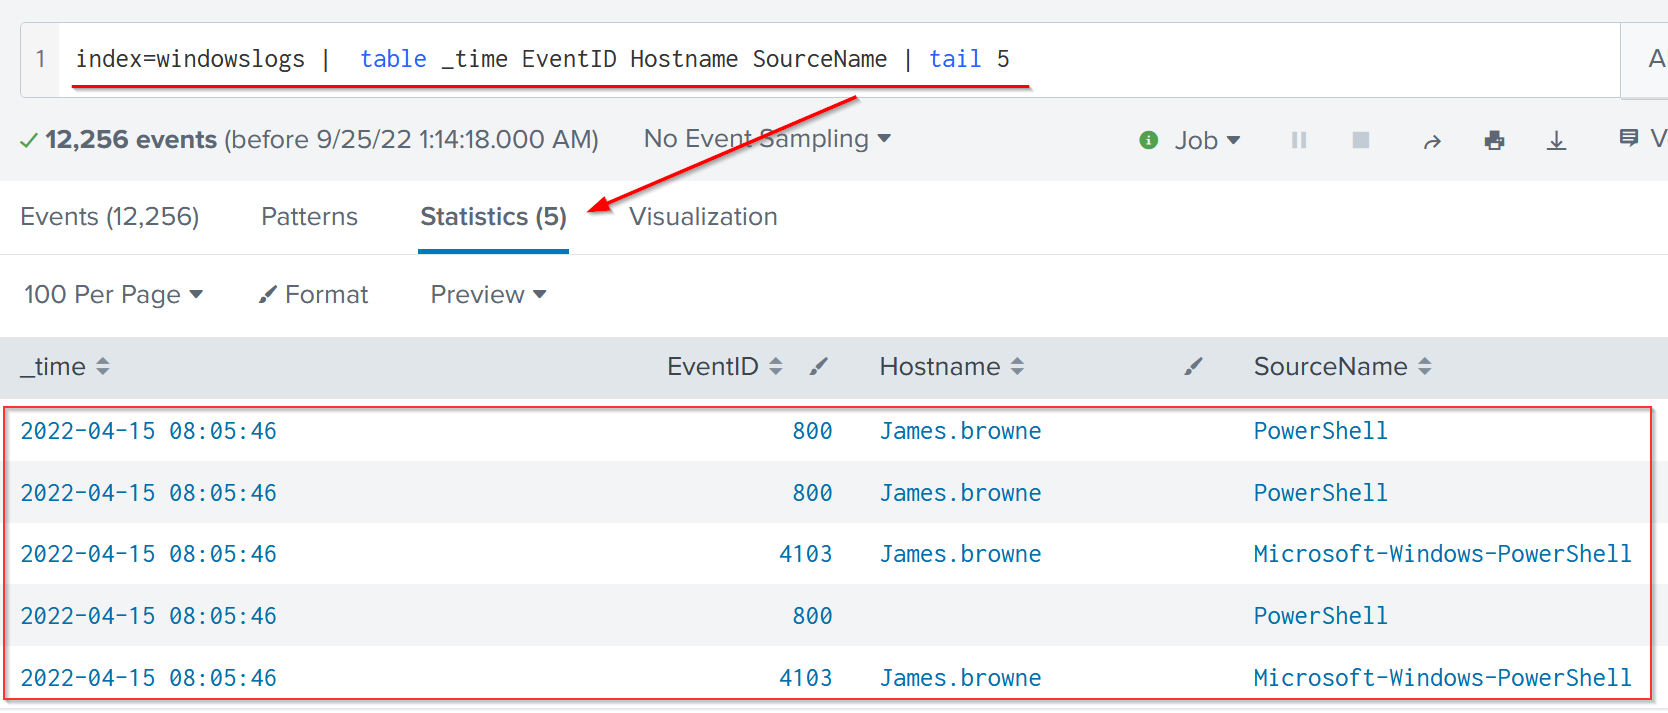
The following search query will show the table containing the mentioned fields and display only 5 entries from the bottom of the list.
Search Query: index=windowslogs | table _time EventID Hostname SourceName | tail 5
sort
| Explanation |
The Sort command allows us to order the fields in ascending or descending order. |
| Syntax |
| sort |
| Example | | sort Hostname # This will sort the result in Ascending order. |
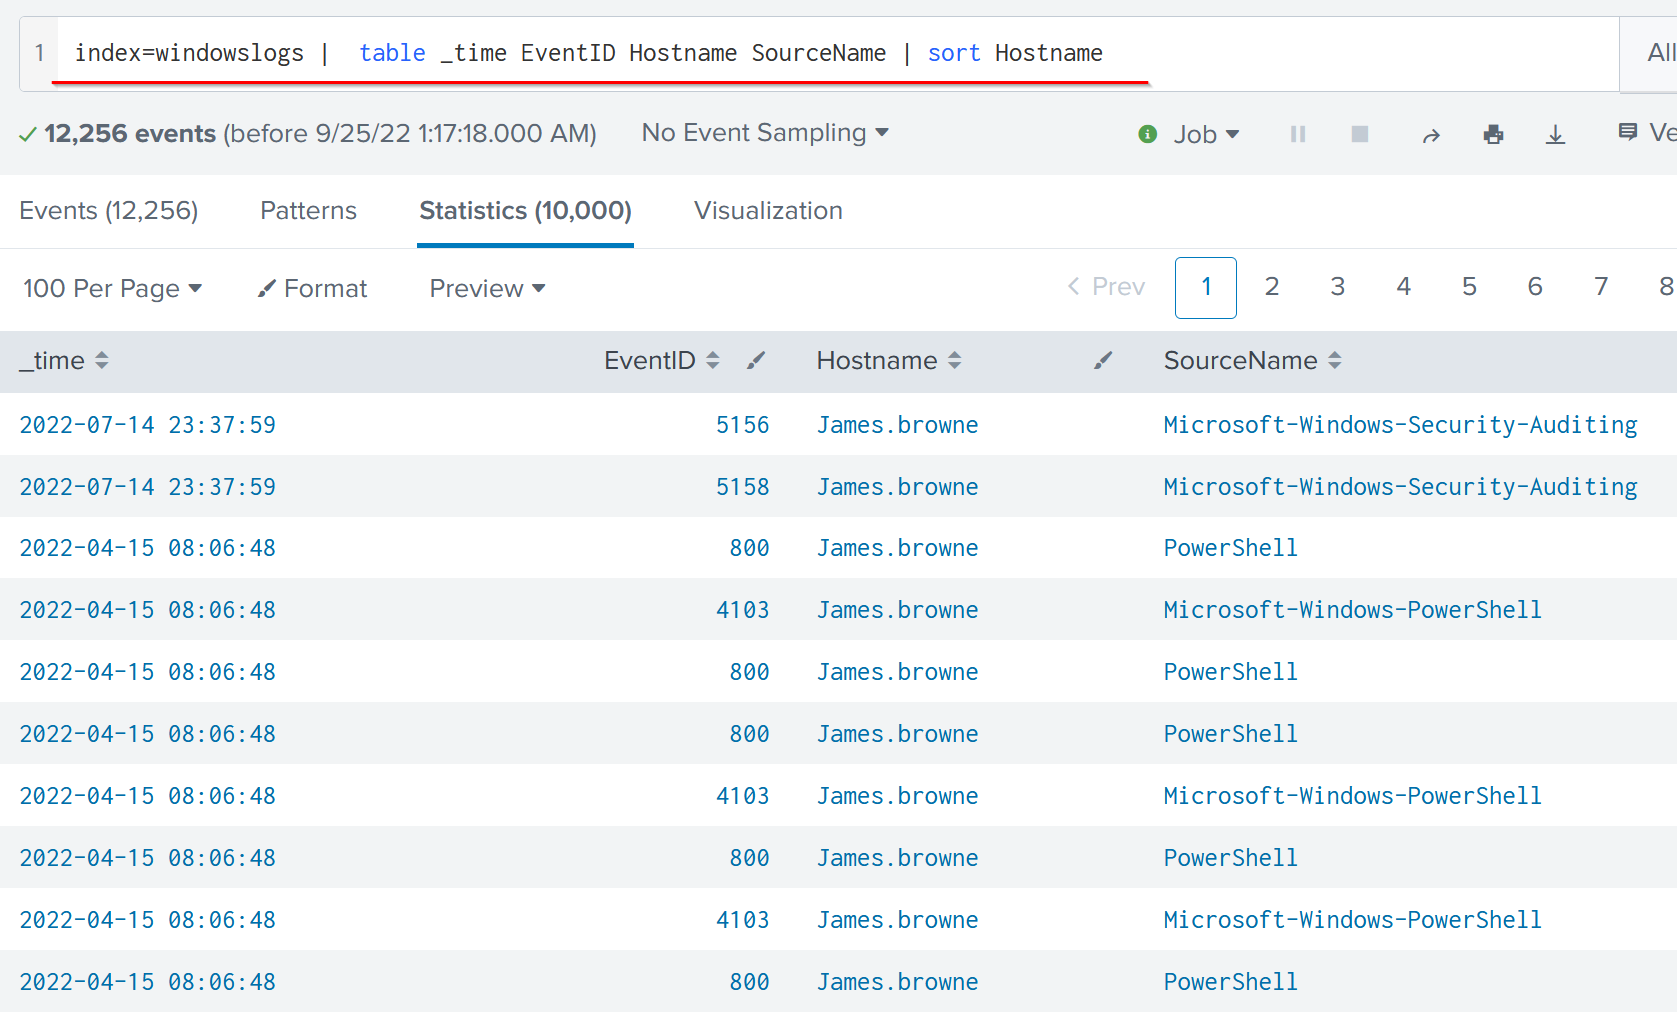
The following search query will sort the results based on the Hostname field.
Search Query: index=windowslogs | table _time EventID Hostname SourceName | sort Hostname
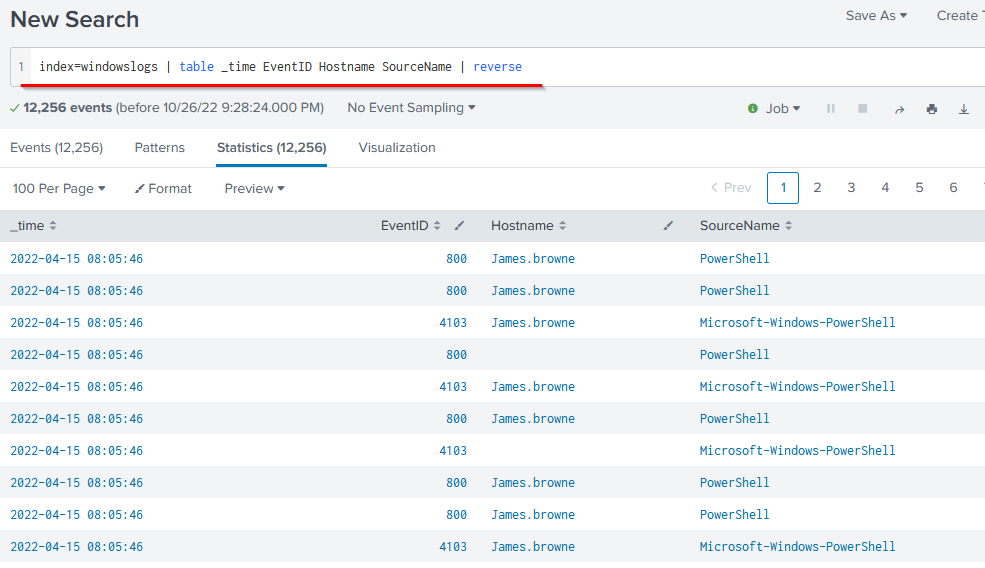
Reverse
| Explanation |
The reverse command simply reverses the order of the events. |
| Syntax |
| reverse |
| Example | <Search Query> \| reverse |
Search Query: index=windowslogs | table _time EventID Hostname SourceName | reverse
Answer the questions below
Using the Reverse command with the search query index=windowslogs | table _time EventID Hostname SourceName - what is the HostName that comes on top?
index=windowslogs | table _time EventID Hostname SourceName
| reverse

Answer: James.browne
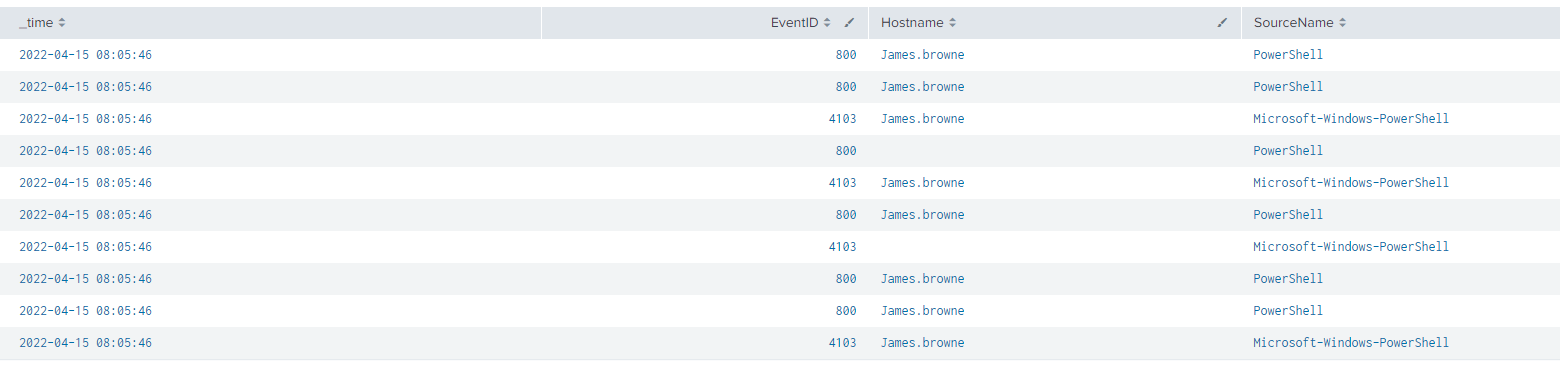
What is the last EventID returned when the query in question 1 is updated with the tail command?
index=windowslogs | table _time EventID Hostname SourceName
|  tail
Answer: 4103
Sort the above query against the SourceName. What is the top SourceName returned?
index=windowslogs | table _time EventID Hostname SourceName
| sort SourceName

Answer: Microsoft-Windows-Directory-Services-SAM
Task 7 Transformational Commands in SPL
Transformational commands are those commands that change the result into a data structure from the field-value pairs. These commands simply transform specific values for each event into numerical values which can easily be utilized for statistical purposes or turn the results into visualizations. Searches that use these transforming commands are called transforming searches. Some of the most used transforming commands are explained below.
General Transformational Commands
Top
| Command | top |
| Explanation |
This command returns frequent values for the top 10 events. |
| Syntax |
| top | top limit=6 |
| Example | top limit=3 EventID |
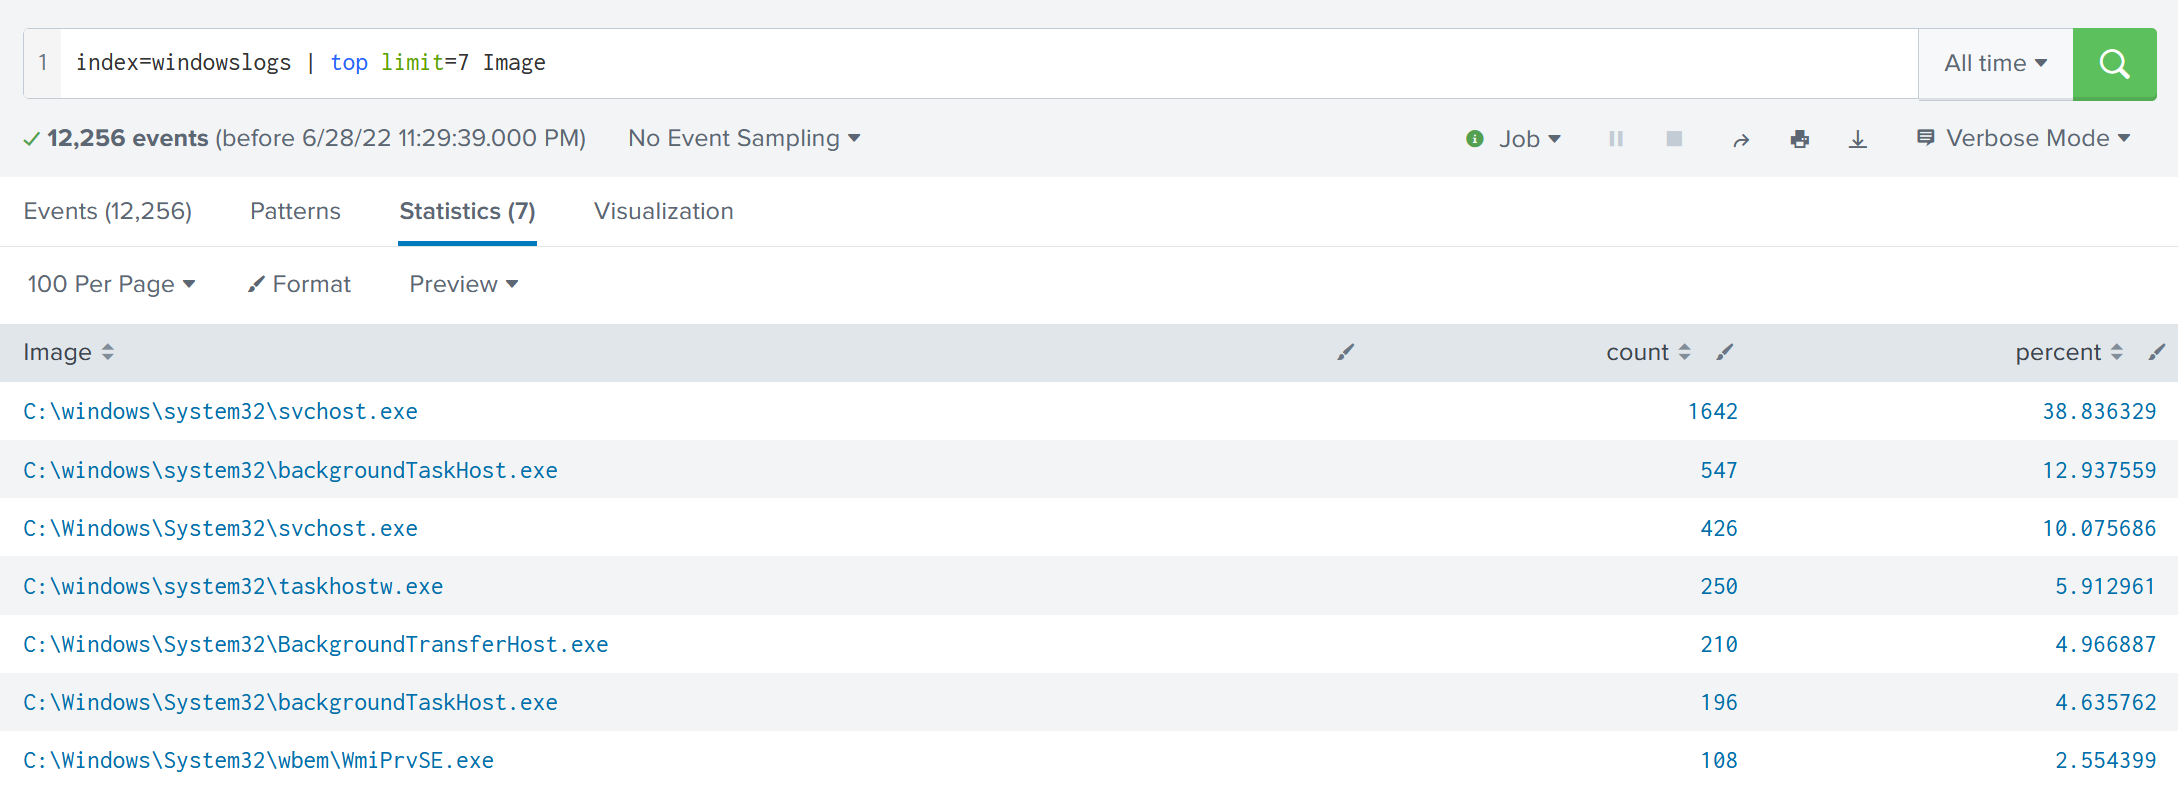
The following command will display the top 7 Image ( representing Processes) captured.
Search Query: index=windowslogs | top limit=7 Image
Rare
| Command | rare |
| Explanation |
This command does the opposite of top command as it returns the least frequent values or bottom 10 results. |
| Syntax |
| rare | rare limit=6 |
| Example | rare limit=3 EventID |
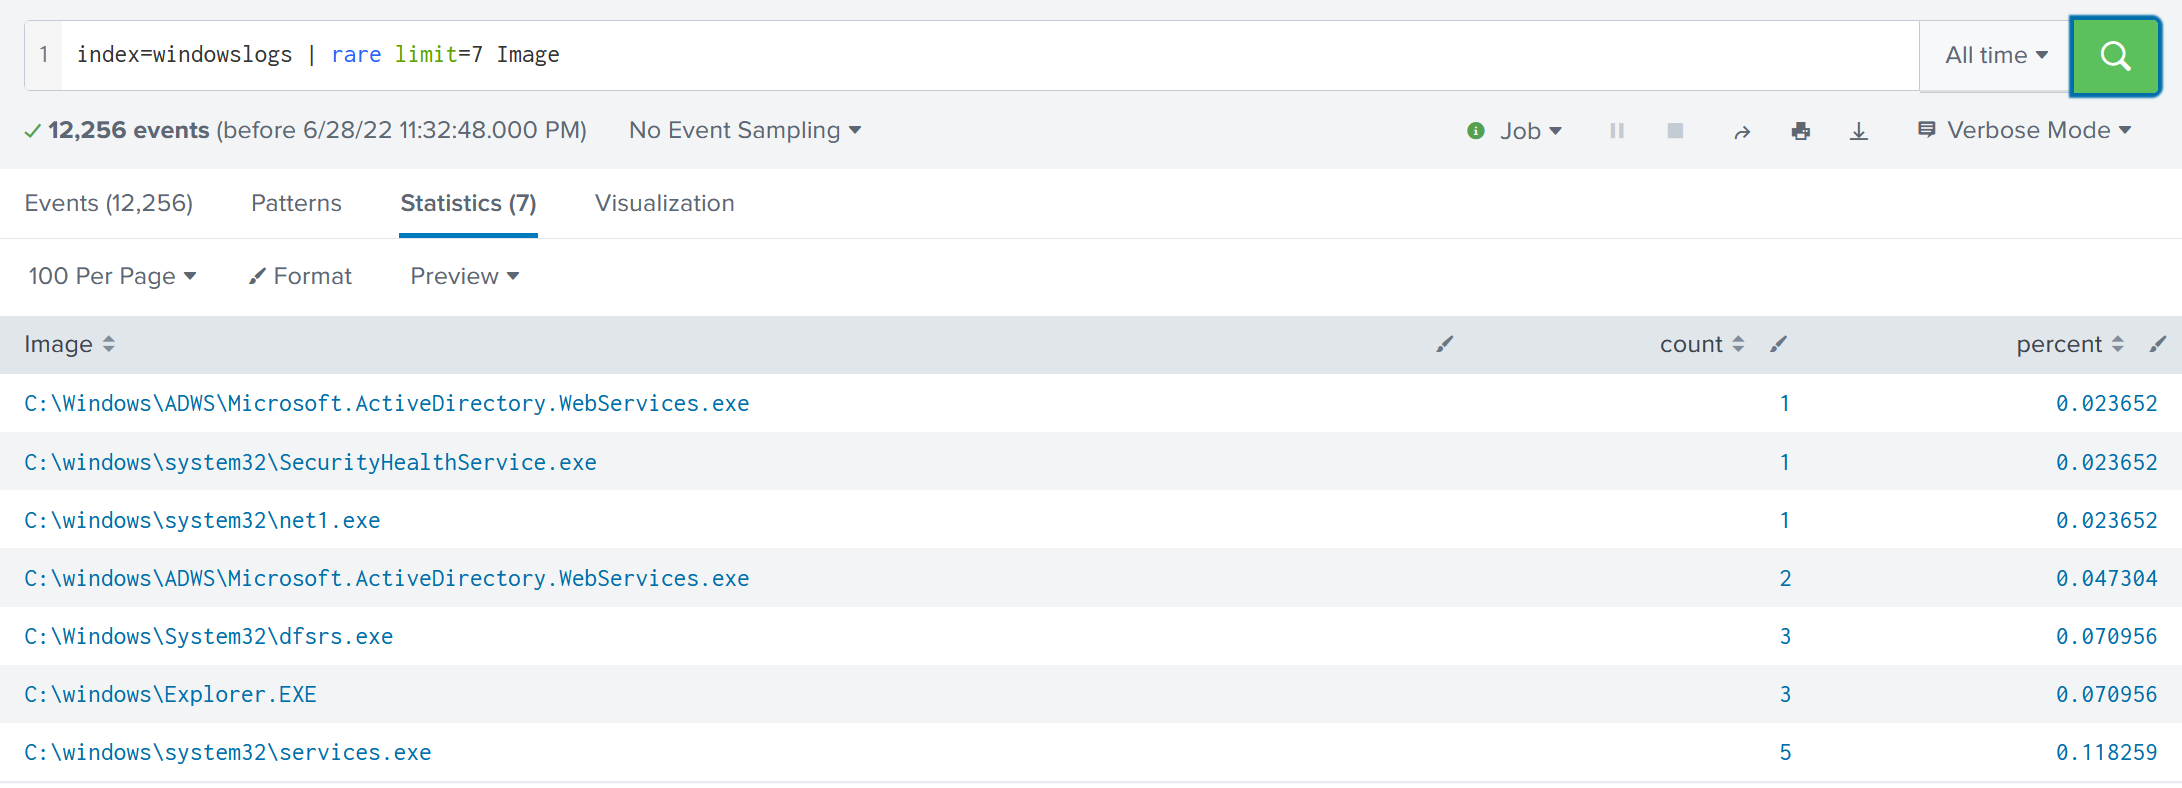
The following command will display the rare 7 Image (Processes) captured.
Search Query: index=windowslogs | rare limit=7 Image
Highlight
| Command | highlight |
| Explanation |
The highlight command shows the results in raw events mode with fields highlighted. |
| Syntax |
highlight |
| Example | highlight User, host, EventID, Image |
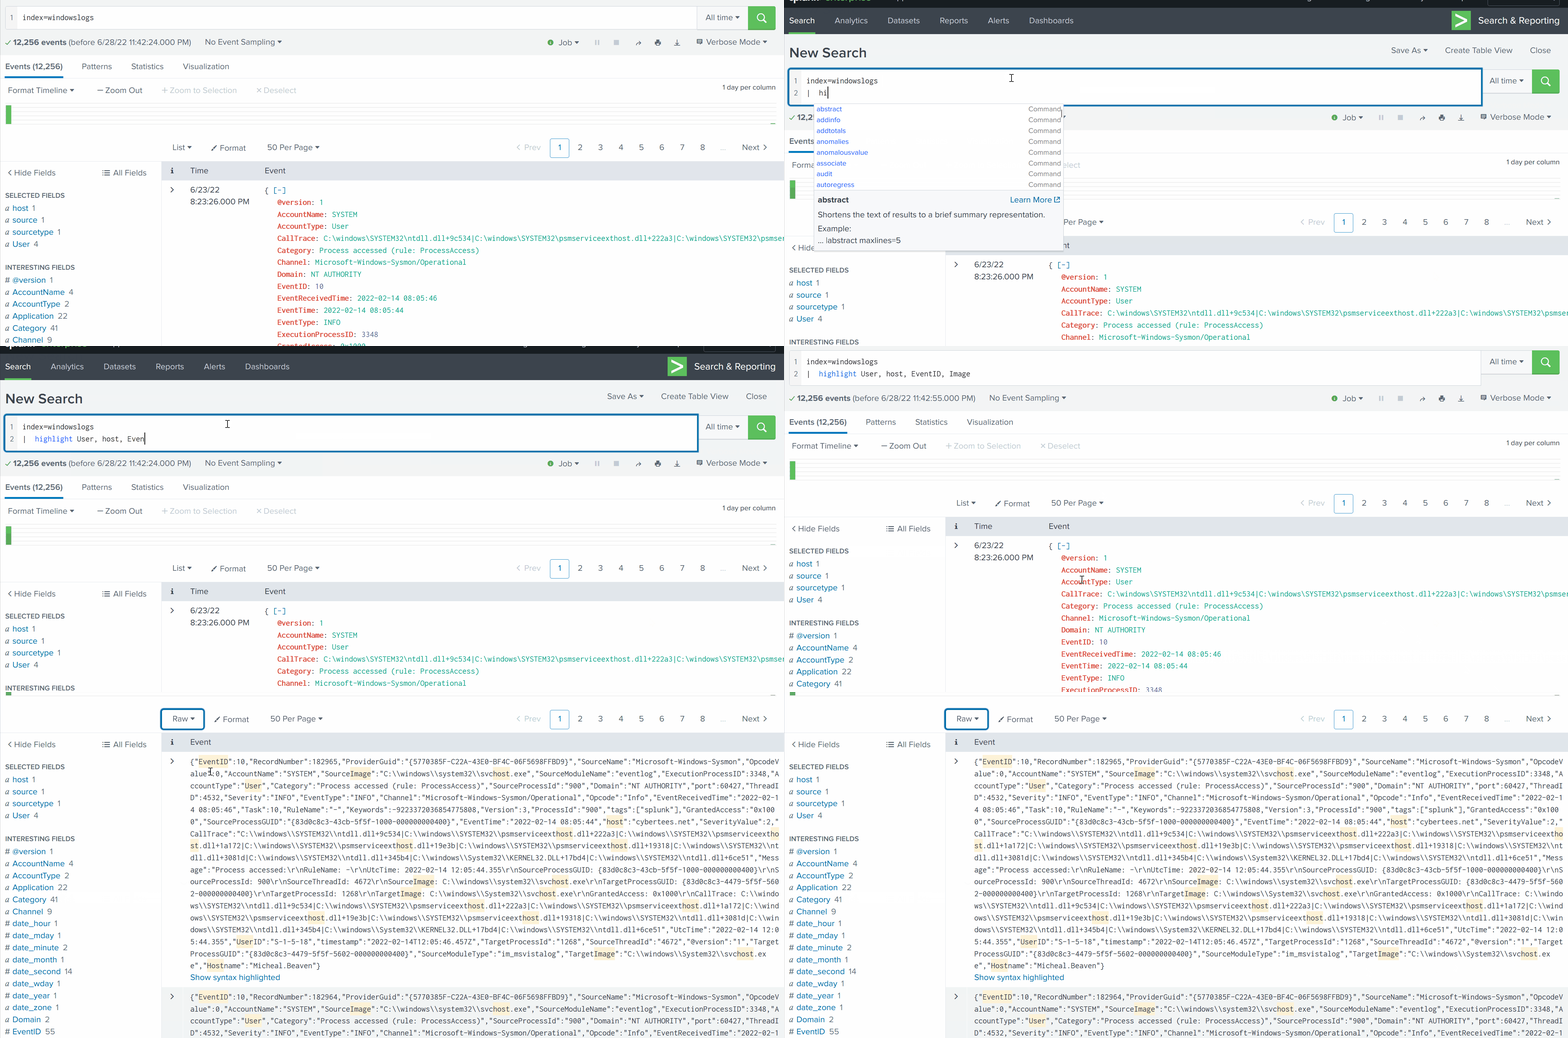
The following command will highlight the three mentioned fields in the raw logs
Search Query: index=windowslogs | highlight User, host, EventID, Image
STATS Commands
SPL supports various stats commands that help in calculating statistics on the values. Some common stat commands are:
| Command | Explanation | Syntax | Example |
| Average |
This command is used to calculate the average of the given field. | stats avg(field_name) | stats avg(product_price) |
| Max |
It will return the maximum value from the specific field. | stats max(field_name) | stats max(user_age) |
| Min | It will return the minimum value from the specific field. | stats min(field_name) | stats min(product_price) |
| Sum | It will return the sum of the fields in a specific value. | stats sum(field_name) | stats sum(product_cost) |
| Count | The count command returns the number of data occurrences. | stats count(function) AS new_NAME | stats count(source_IP) |
Splunk Chart Commands
These are very important types of transforming commands that are used to present the data in table or visualization form. Most of the chart commands utilize various stat commands.
Chart
| Command | chart |
| Explanation |
The chart command is used to transform the data into tables or visualizations. |
| Syntax |
| chart |
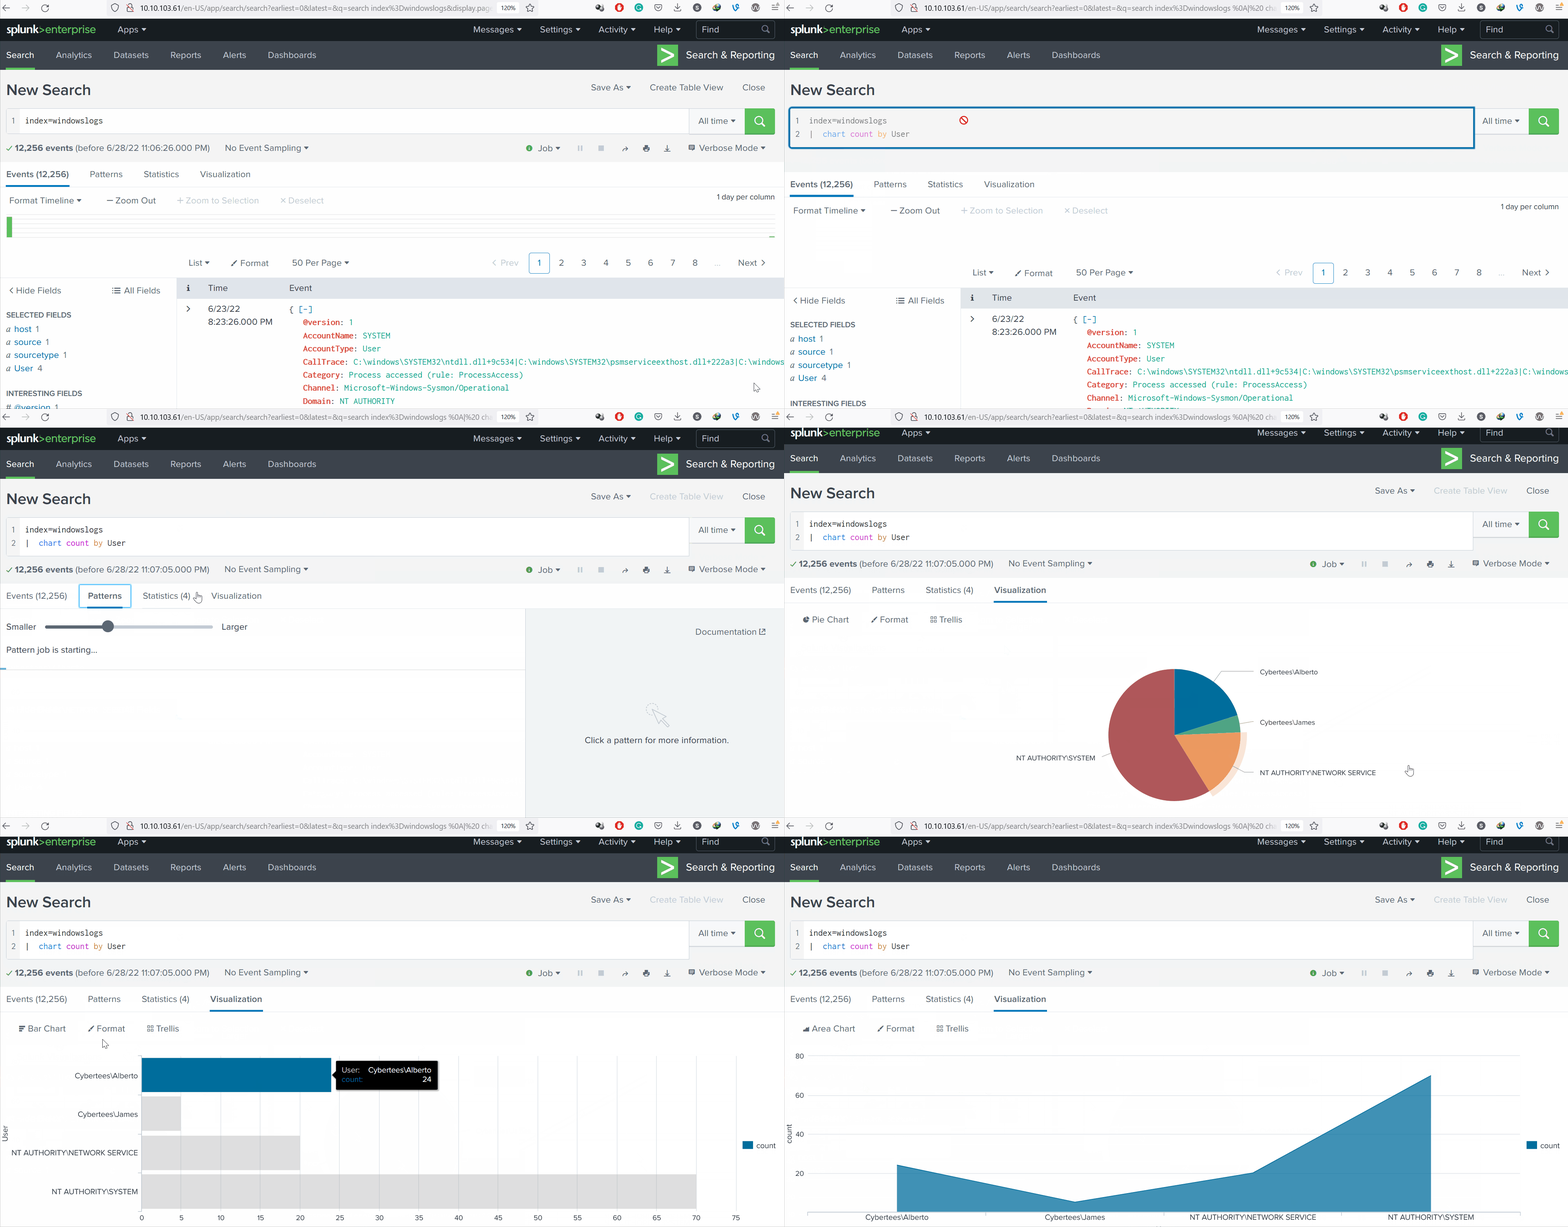
| Example | | chart count by User |
Search Query: index=windowslogs | chart count by User
Timechart
| Command | timechart |
| Explanation |
The timechart command returns the time series chart covering the field following the function mentioned. Often combined with STATS commands. |
| Syntax |
| timechart function |
| Example | | timechart count by Image |
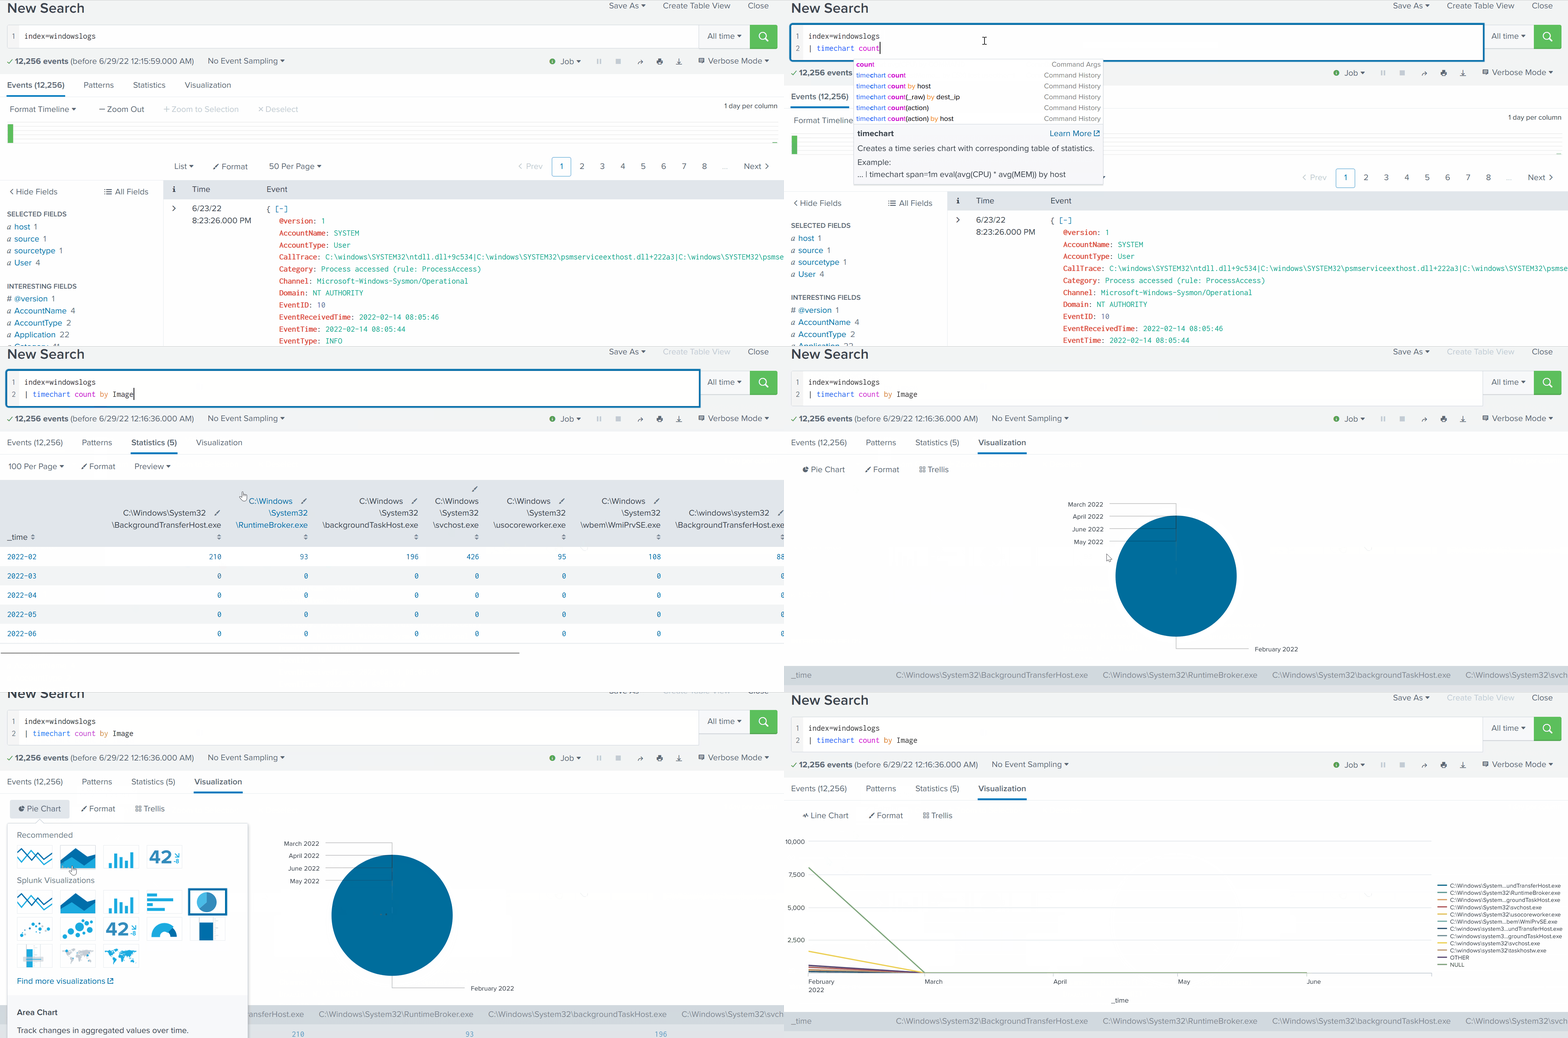
The following query will display the Image chart based on the time.
Search Query: index=windowslogs | timechart count by Image
Answer the questions below
List the top 8 Image processes using the top command - what is the total count of the 6th Image?
index=windowslogs
| top limit=8 Image

Answer: 196
Using the rare command, identify the user with the least number of activities captured?
index=windowslogs
| rare User

Answer: James
Create a pie-chart using the chart command - what is the count for the conhost.exe process?
index=windowslogs
| chart count by Image
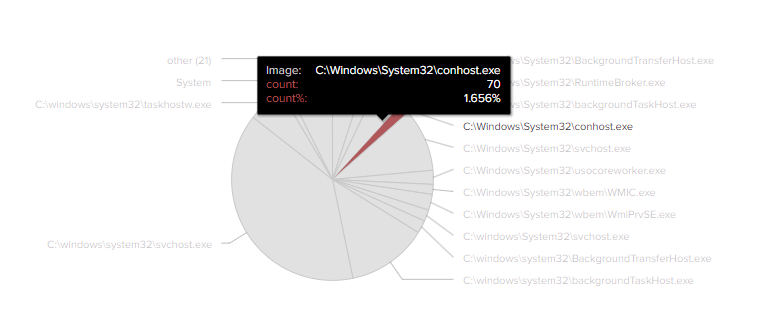
Answer: 70
Task 8 Recap and Conclusion
This wraps up the Splunk SPL room.
We have covered various functions and commands used together to form search queries to look for the data more effectively. To practice more, look at the following Splunk rooms and challenges.